Anomalies
The Anomalies Dashboard provides visibility into activity across the organization that deviates from a calculated baseline. This is a great starting point for identify suspicious behaviors.
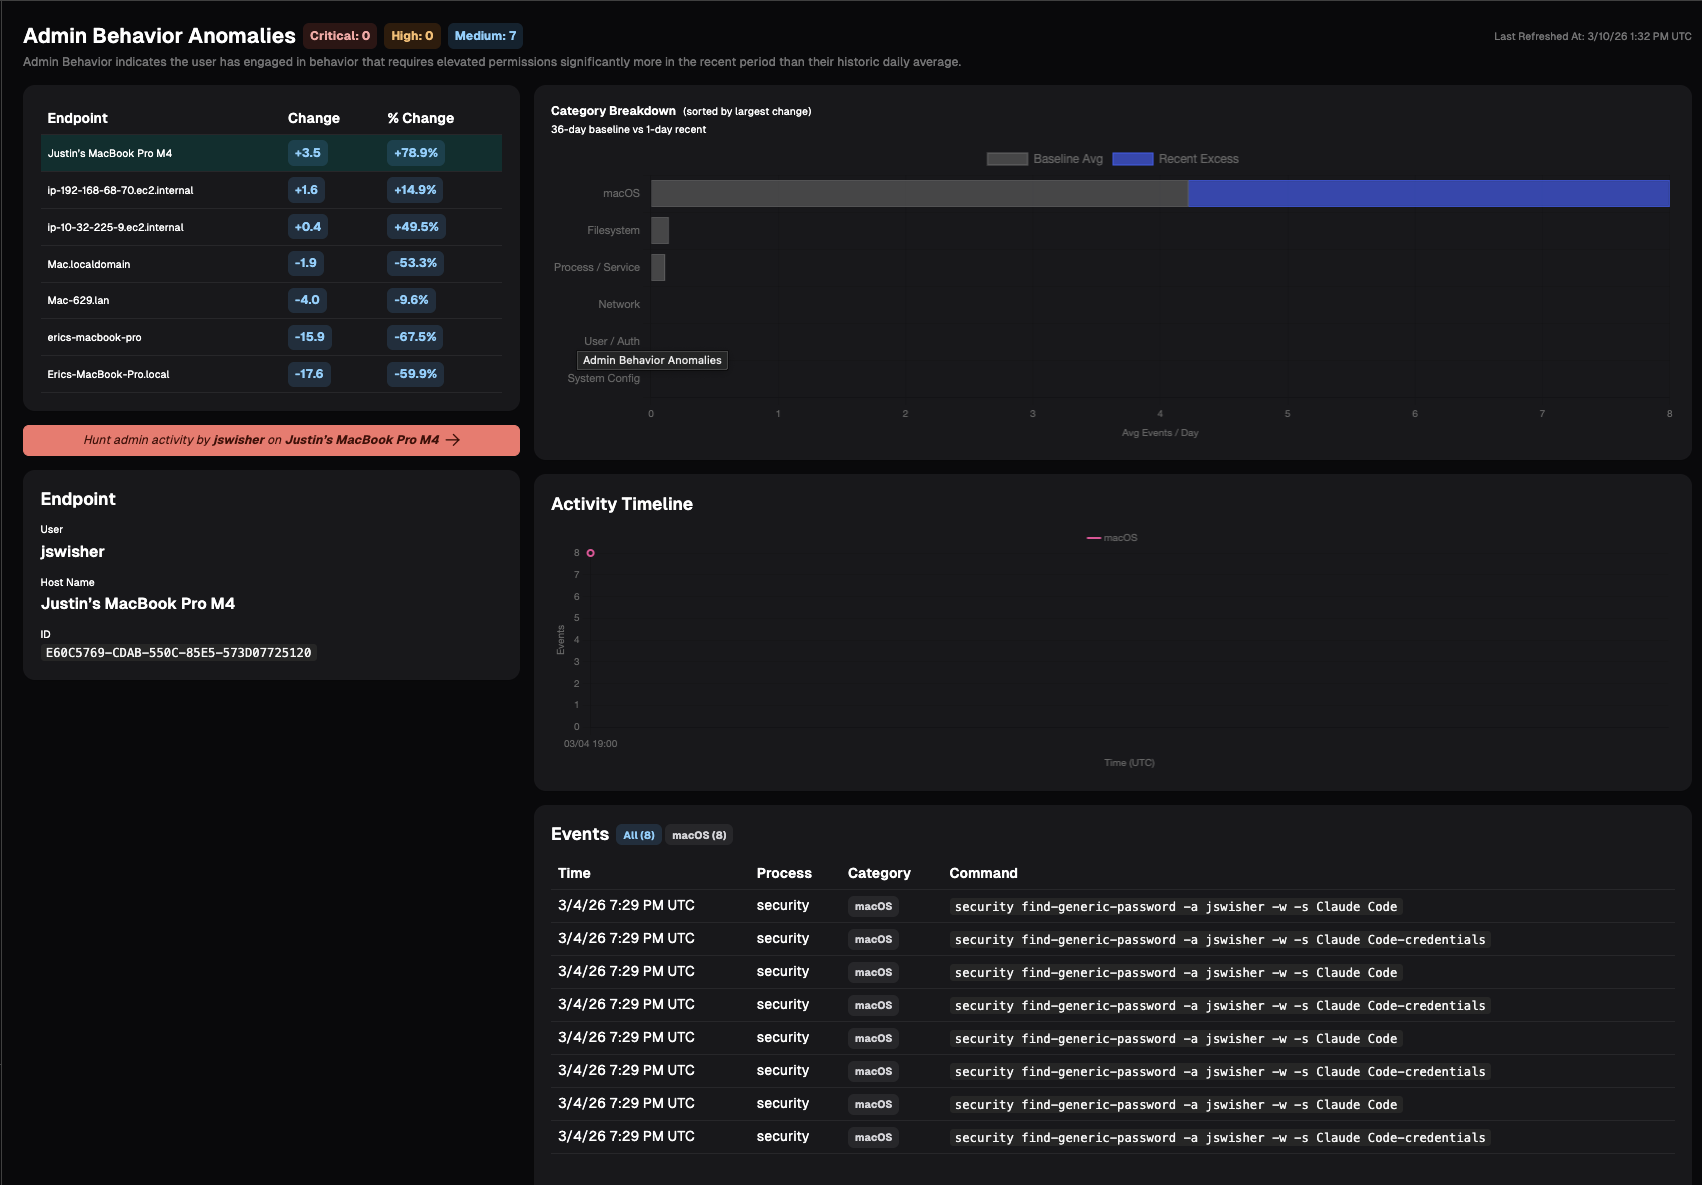
Admin Behavior
Admin Behavior indicates the user has engaged in behavior that requires elevated permissions significantly more in the recent period than their historic daily average. Examples include:
- Process/Service: Starting, stopping, enabling, or otherwise managing system services and daemons
- Filesystem: Writing/copying files into system directories; changing ownership or permissions on system paths; mounting/unmounting volumes; raw disk access.
- Network: Binding to privileged ports; packet capture; modifying firewall rules; changing network interfaces, routes, or ARP tables; enabling promiscuous mode.
- User/Auth: Creating, deleting, or modifying user/group accounts; changing other users' passwords; editing sudoers, /etc/shadow, PAM config, or authorized_keys; Windows equivalents.
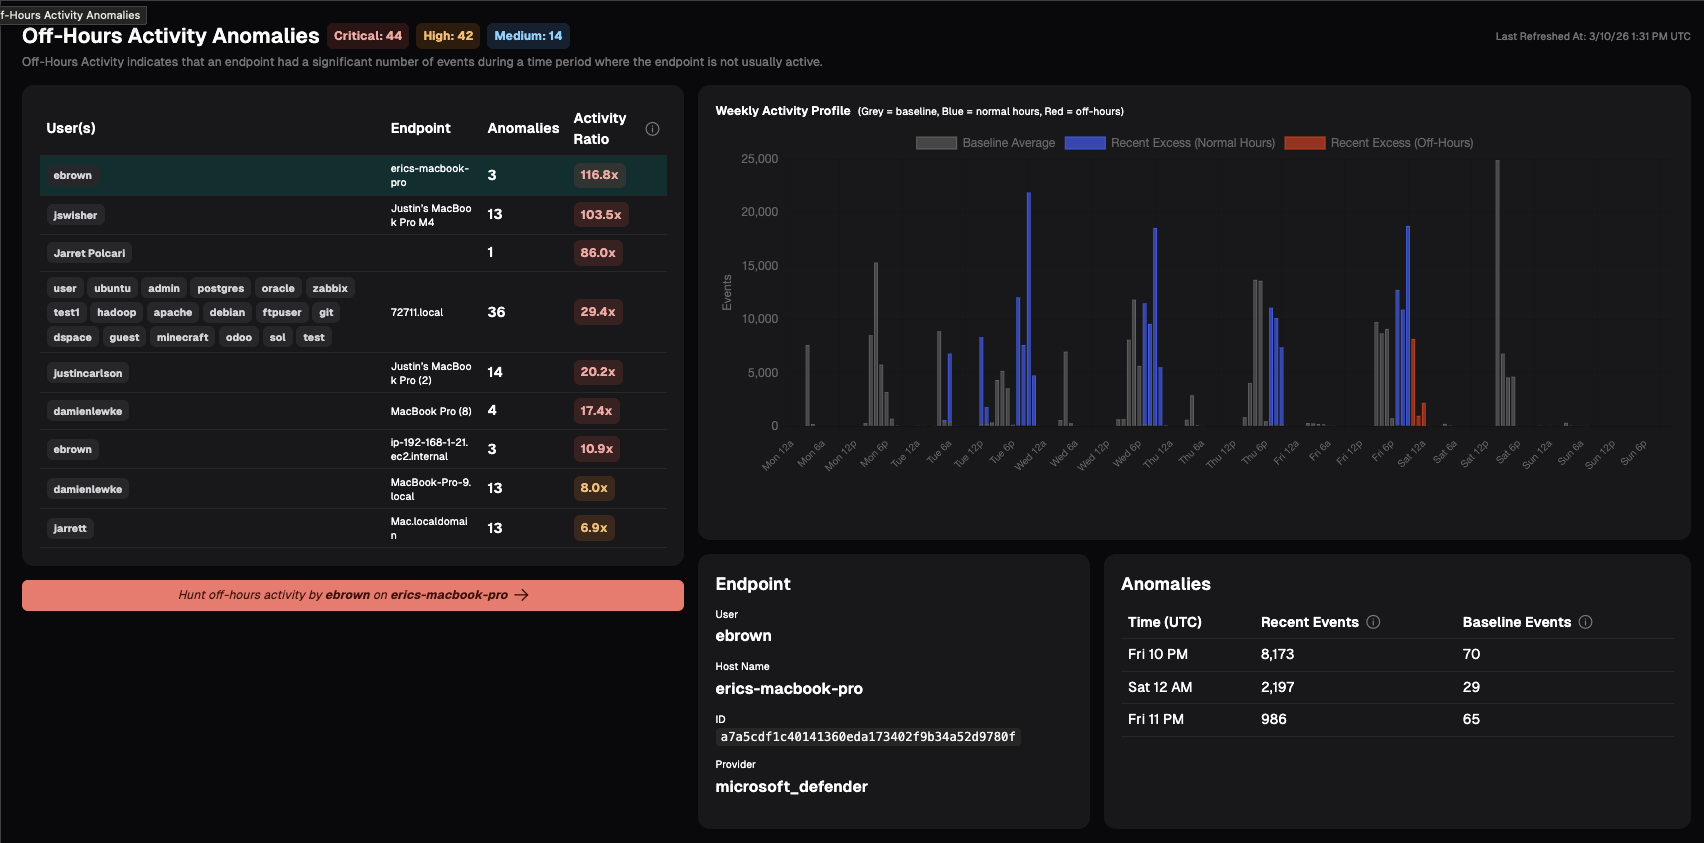
Off-Hours Activity
Off-Hours Activity indicates that an endpoint had a significant number of events during a time period where the endpoint is not usually active.
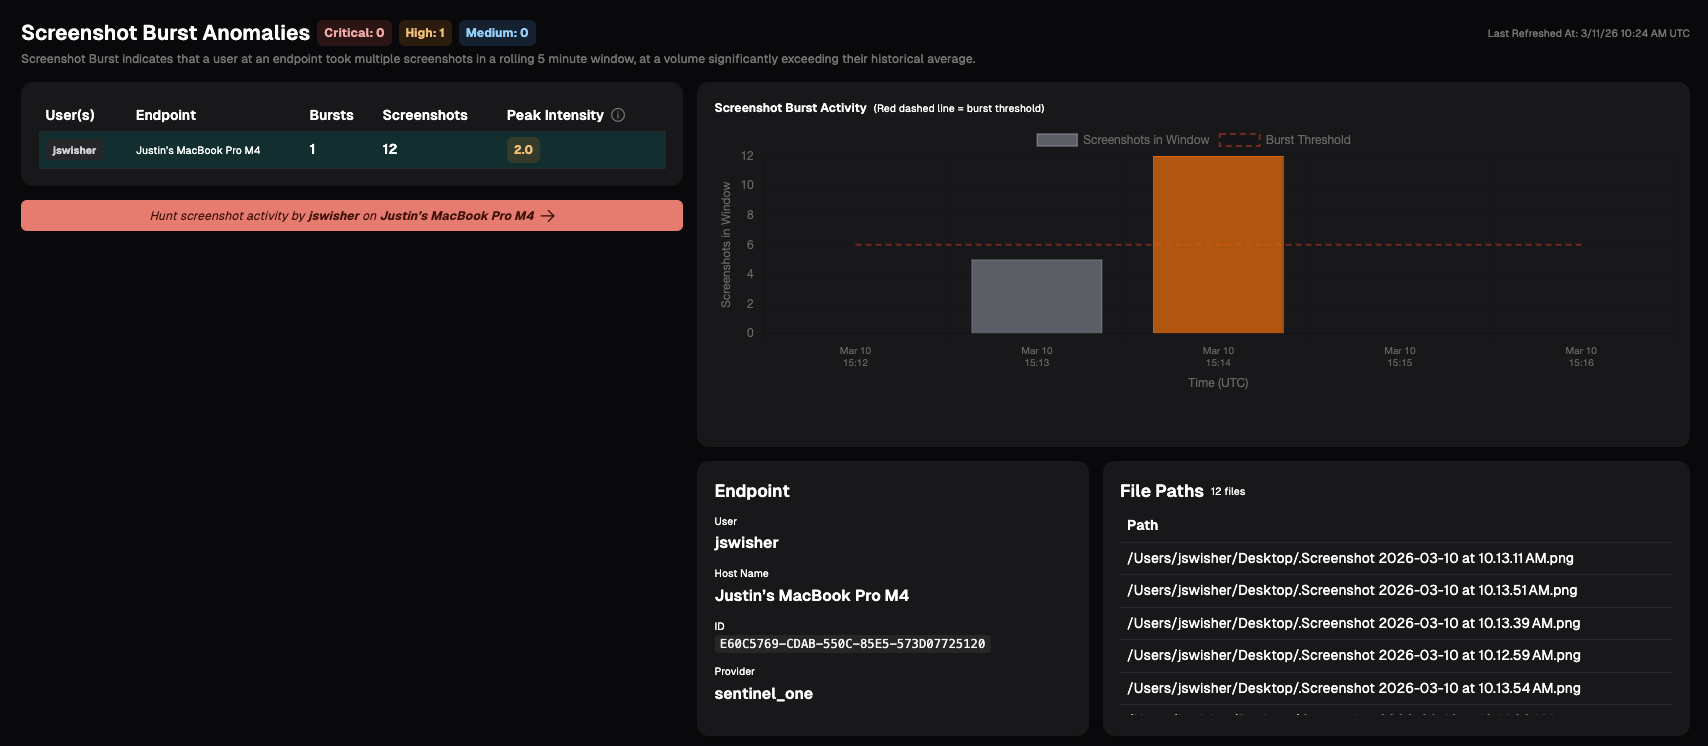
Screenshot Burst
Screenshot Burst indicates that a user at an endpoint took multiple screenshots in a rolling 5 minute window, at a volume significantly exceeding their historical average. This anomaly may indicate the user is engaged in data harvesting, capturing sensitive information, or other insider risk behavior.
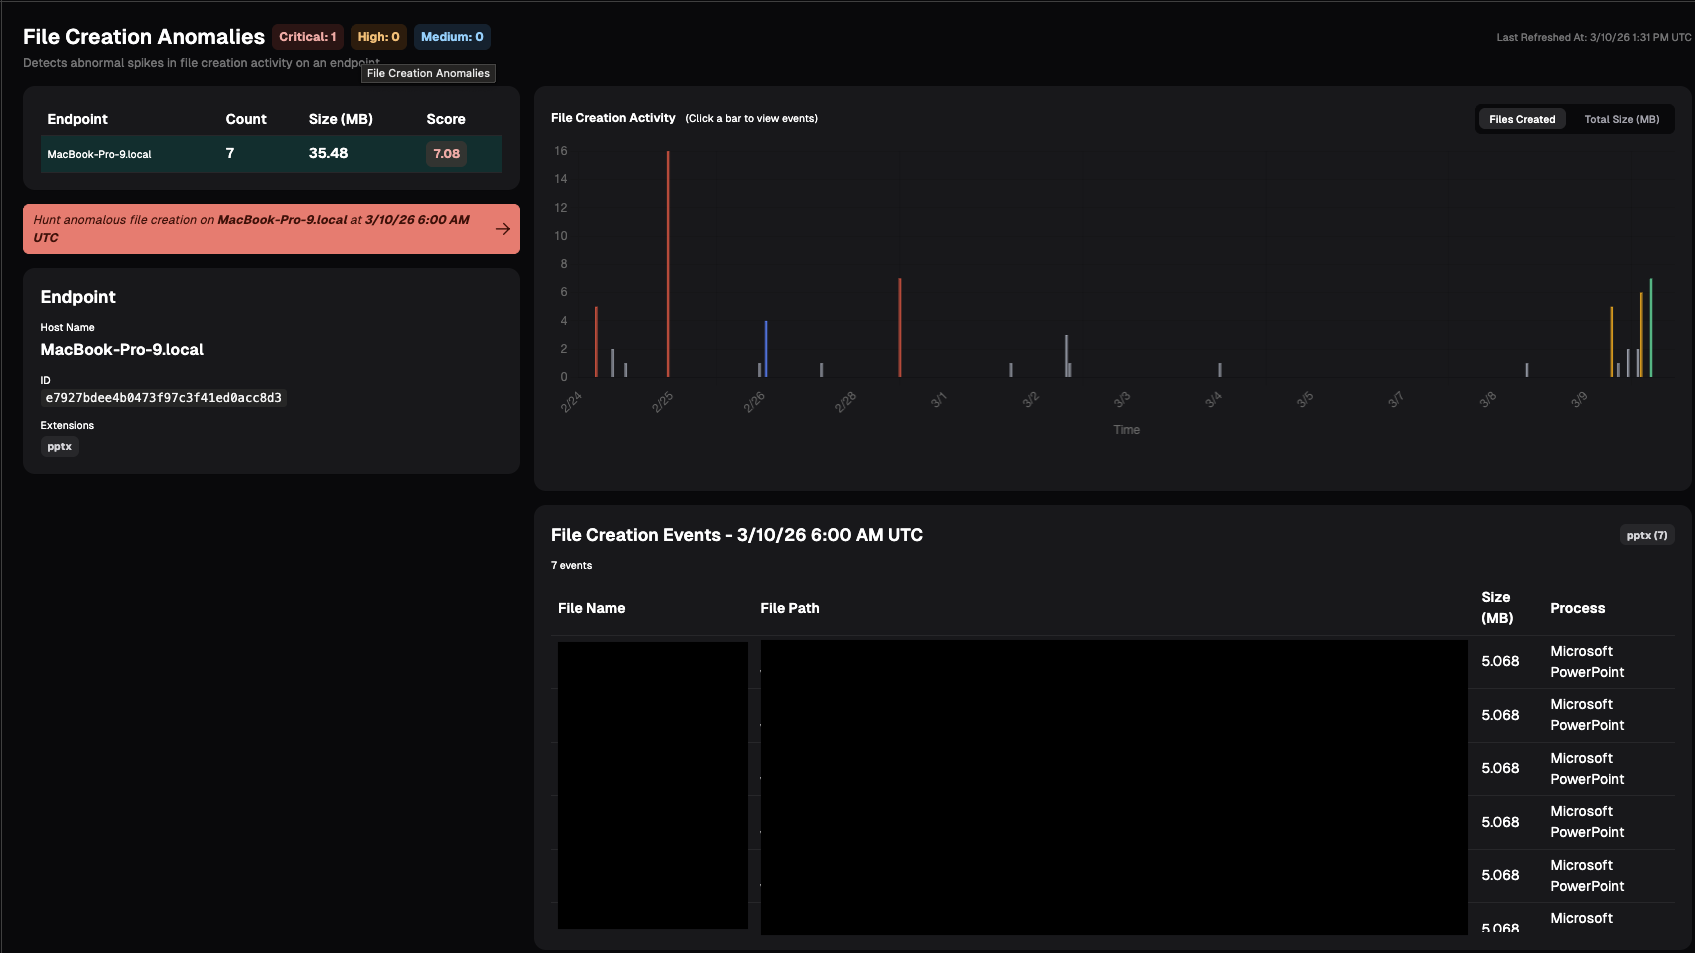
File Creation
File anomaly detection monitors how many files are being created on each endpoint over time. This may indicate the user is staging data for exfiltration or other potential risky behavior.
File anomaly detection monitors how many files are being created on each endpoint over time. Nebulock will establish a normal baseline for this activity and continuously compare current behavior against that baseline. If we see a sudden spike that’s significantly higher than what’s typical for that system, it will show up here as anomalous.